‏إظهار الرسائل ذات التسميات waves. إظهار كافة الرسائل

Motion Characteristics for Circular Motion

Speed and Velocity

 The motion of a moving object can be explained using either Newton's Laws  and vector principles  or by means of the Work-Energy Theorem. The same concepts and principles used to describe and explain the motion of an object can be used to describe and explain the parabolic motion of a projectile. In this unit, we will see that these same concepts and principles can also be used to describe and explain the motion of objects that either move in circles or can be approximated to be moving in circles. Kinematic concepts and motion principles will be applied to the motion of objects in circles and then extended to analyze the motion of such objects as roller coaster cars, a football player making a circular turn, and a planet orbiting the sun. We will see that the beauty and power of physics lies in the fact that a few simple concepts and principles can be used to explain the mechanics of the entire universe. Lesson 1 of this study will begin with the development of kinematic and dynamic ideas that can be used to describe and explain the motion of objects in circles.

Suppose that you were driving a car with the steering wheel turned in such a manner that your car followed the path of a perfect circle with a constant radius. And suppose that as you drove, your speedometer maintained a constant reading of 10 mi/hr. In such a situation as this, the motion of your car could be described as experiencing uniform circular motion. Uniform circular motion is the motion of an object in a circle with a constant or uniform speed.

Calculation of the Average Speed
Uniform circular motion - circular motion at a constant speed - is one of many forms of circular motion. An object moving in uniform circular motion would cover the same linear distance in each second of time. When moving in a circle, an object traverses a distance around the perimeter of the circle. So if your car were to move in a circle with a constant speed of 5 m/s, then the car would travel 5 meters along the perimeter of the circle in each second of time. The distance of one complete cycle around the perimeter of a circle is known as the circumference. With a uniform speed of 5 m/s, a car could make a complete cycle around a circle that had a circumference of 5 meters. At this uniform speed of 5 m/s, each cycle around the 5-m circumference circle would require 1 second. At 5 m/s, a circle with a circumference of 20 meters could be made in 4 seconds; and at this uniform speed, every cycle around the 20-m circumference of the circle would take the same time period of 4 seconds. This relationship between the circumference of a circle, the time to complete one cycle around the circle, and the speed of the object is merely an extension of the average speed equation stated.
The circumference of any circle can be computed using from the radius according to the equation
Circumference = 2*pi*Radius
Combining these two equations above will lead to a new equation relating the speed of an object moving in uniform circular motion to the radius of the circle and the time to make one cycle around the circle (period).
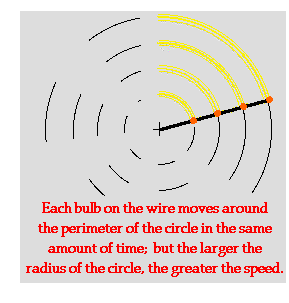
where R represents the radius of the circle and T represents the period. This equation, like all equations, can be used as an algebraic recipe for problem solving. It also can be used to guide our thinking about the variables in the equation relate to each other. For instance, the equation suggests that for objects moving around circles of different radius in the same period, the object traversing the circle of larger radius must be traveling with the greatest speed. In fact, the average speed and the radius of the circle are directly proportional. A twofold increase in radius corresponds to a twofold increase in speed; a threefold increase in radius corresponds to a three--fold increase in speed; and so on. To illustrate, consider a strand of four LED lights positioned at various locations along the strand. The strand is held at one end and spun rapidly in a circle. Each LED light traverses a circle of different radius. Yet since they are connected to the same wire, their period of rotation is the same. Subsequently, the LEDs that are further from the center of the circle are traveling faster in order to sweep out the circumference of the larger circle in the same amount of time. If the room lights are turned off, the LEDs created an arc that could be perceived to be longer for those LEDs that were traveling faster - the LEDs with the greatest radius. This is illustrated in the diagram at the right.
 

The Direction of the Velocity Vector
Objects moving in uniform circular motion will have a constant speed. But does this mean that they will have a constant velocity? Recall that speed and velocity refer to two distinctly different quantities. Speed is a scalar quantity and velocity is a vector quantity. Velocity, being a vector, has both a magnitude and a direction. The magnitude of the velocity vector is the instantaneous speed of the object. The direction of thevelocity vector is directed in the same direction that the object moves. Since an object is moving in a circle, its direction is continuously changing. At one moment, the object is moving northward such that the velocity vector is directed northward. One quarter of a cycle later, the object would be moving eastward such that the velocity vector is directed eastward. As the object rounds the circle, the direction of the velocity vector is different than it was the instant before. So while the magnitude of the velocity vector may be constant, the direction of the velocity vector is changing. The best word that can be used to describe the direction of the velocity vector is the word tangential. The direction of the velocity vector at any instant is in the direction of a tangent line drawn to the circle at the object's location. (A tangent line is a line that touches a circle at one point but does not intersect it.) The diagram at the right shows the direction of the velocity vector at four different points for an object moving in a clockwise direction around a circle. While the actual direction of the object (and thus, of the velocity vector) is changing, its direction is always tangent to the circle.
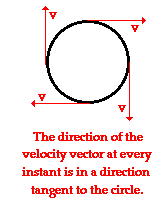
To summarize, an object moving in uniform circular motion is moving around the perimeter of the circle with a constant speed. While the speed of the object is constant, its velocity is changing. Velocity, being a vector, has a constant magnitude but a changing direction. The direction is always directed tangent to the circle and as the object turns the circle, the tangent line is always pointing in a new direction.

Speed and Velocity

 The motion of a moving object can be explained using either Newton's Laws  and vector principles  or by means of the Work-Energy Theorem. The same concepts and principles used to describe and explain the motion of an object can be used to describe and explain the parabolic motion of a projectile. In this unit, we will see that these same concepts and principles can also be used to describe and explain the motion of objects that either move in circles or can be approximated to be moving in circles. Kinematic concepts and motion principles will be applied to the motion of objects in circles and then extended to analyze the motion of such objects as roller coaster cars, a football player making a circular turn, and a planet orbiting the sun. We will see that the beauty and power of physics lies in the fact that a few simple concepts and principles can be used to explain the mechanics of the entire universe. Lesson 1 of this study will begin with the development of kinematic and dynamic ideas that can be used to describe and explain the motion of objects in circles.

Suppose that you were driving a car with the steering wheel turned in such a manner that your car followed the path of a perfect circle with a constant radius. And suppose that as you drove, your speedometer maintained a constant reading of 10 mi/hr. In such a situation as this, the motion of your car could be described as experiencing uniform circular motion. Uniform circular motion is the motion of an object in a circle with a constant or uniform speed.

Calculation of the Average Speed
Uniform circular motion - circular motion at a constant speed - is one of many forms of circular motion. An object moving in uniform circular motion would cover the same linear distance in each second of time. When moving in a circle, an object traverses a distance around the perimeter of the circle. So if your car were to move in a circle with a constant speed of 5 m/s, then the car would travel 5 meters along the perimeter of the circle in each second of time. The distance of one complete cycle around the perimeter of a circle is known as the circumference. With a uniform speed of 5 m/s, a car could make a complete cycle around a circle that had a circumference of 5 meters. At this uniform speed of 5 m/s, each cycle around the 5-m circumference circle would require 1 second. At 5 m/s, a circle with a circumference of 20 meters could be made in 4 seconds; and at this uniform speed, every cycle around the 20-m circumference of the circle would take the same time period of 4 seconds. This relationship between the circumference of a circle, the time to complete one cycle around the circle, and the speed of the object is merely an extension of the average speed equation stated.
The circumference of any circle can be computed using from the radius according to the equation
Circumference = 2*pi*Radius
Combining these two equations above will lead to a new equation relating the speed of an object moving in uniform circular motion to the radius of the circle and the time to make one cycle around the circle (period).
where R represents the radius of the circle and T represents the period. This equation, like all equations, can be used as an algebraic recipe for problem solving. It also can be used to guide our thinking about the variables in the equation relate to each other. For instance, the equation suggests that for objects moving around circles of different radius in the same period, the object traversing the circle of larger radius must be traveling with the greatest speed. In fact, the average speed and the radius of the circle are directly proportional. A twofold increase in radius corresponds to a twofold increase in speed; a threefold increase in radius corresponds to a three--fold increase in speed; and so on. To illustrate, consider a strand of four LED lights positioned at various locations along the strand. The strand is held at one end and spun rapidly in a circle. Each LED light traverses a circle of different radius. Yet since they are connected to the same wire, their period of rotation is the same. Subsequently, the LEDs that are further from the center of the circle are traveling faster in order to sweep out the circumference of the larger circle in the same amount of time. If the room lights are turned off, the LEDs created an arc that could be perceived to be longer for those LEDs that were traveling faster - the LEDs with the greatest radius. This is illustrated in the diagram at the right.
 

The Direction of the Velocity Vector
Objects moving in uniform circular motion will have a constant speed. But does this mean that they will have a constant velocity? Recall that speed and velocity refer to two distinctly different quantities. Speed is a scalar quantity and velocity is a vector quantity. Velocity, being a vector, has both a magnitude and a direction. The magnitude of the velocity vector is the instantaneous speed of the object. The direction of thevelocity vector is directed in the same direction that the object moves. Since an object is moving in a circle, its direction is continuously changing. At one moment, the object is moving northward such that the velocity vector is directed northward. One quarter of a cycle later, the object would be moving eastward such that the velocity vector is directed eastward. As the object rounds the circle, the direction of the velocity vector is different than it was the instant before. So while the magnitude of the velocity vector may be constant, the direction of the velocity vector is changing. The best word that can be used to describe the direction of the velocity vector is the word tangential. The direction of the velocity vector at any instant is in the direction of a tangent line drawn to the circle at the object's location. (A tangent line is a line that touches a circle at one point but does not intersect it.) The diagram at the right shows the direction of the velocity vector at four different points for an object moving in a clockwise direction around a circle. While the actual direction of the object (and thus, of the velocity vector) is changing, its direction is always tangent to the circle.

To summarize, an object moving in uniform circular motion is moving around the perimeter of the circle with a constant speed. While the speed of the object is constant, its velocity is changing. Velocity, being a vector, has a constant magnitude but a changing direction. The direction is always directed tangent to the circle and as the object turns the circle, the tangent line is always pointing in a new direction.
Motion of a Mass on a Spring

Motion of a Mass on a Spring

 the motion of a mass attached to a spring is described as an example of a vibrating system. The mass on a spring motion was discussed in more detail as we sought to understand the mathematical properties of objects that are in periodic motion. Now we will investigate the motion of a mass on a spring in even greater detail as we focus on how a variety of quantities change over the course of time. Such quantities will include forces, position, velocity and energy - both kinetic and potential energy.
Hooke's Law
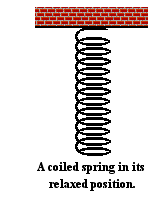
We will begin our discussion with an investigation of the forces exerted by a spring on a hanging mass. Consider the system shown at the right with a spring attached to a support. The spring hangs in a relaxed, unstretched position. If you were to hold the bottom of the spring and pull downward, the spring would stretch. If you were to pull with just a little force, the spring would stretch just a little bit. And if you were to pull with a much greater force, the spring would stretch a much greater extent. Exactly what is the quantitative relationship between the amount of pulling force and the amount of stretch?
To determine this quantitative relationship between the amount of force and the amount of stretch, objects of known mass could be attached to the spring. For each object which is added, the amount of stretch could be measured. The force which is applied in each instance would be the weight of the object. A regression analysis of the force-stretch data could be performed in order to determine the quantitative relationship between the force and the amount of stretch. The data table below shows some representative data for such an experiment.
Mass (kg)
Force on Spring (N)
Amount of Stretch (m)
0.000
0.000
0.0000
0.050
0.490
0.0021
0.100
0.980
0.0040
0.150
1.470
0.0063
0.200
1.960
0.0081
0.250
2.450
0.0099
0.300
2.940
0.0123
0.400
3.920
0.0160
0.500
4.900
0.0199

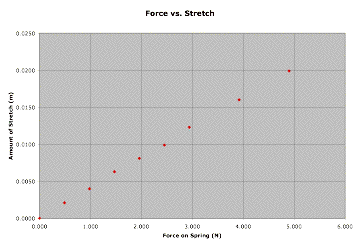
By plotting the force-stretch data and performing a linear regression analysis, the quantitative relationship or equation can be determined. The plot is shown below.
A linear regression analysis yields the following statistics:
slope = 0.00406 m/N
y-intercept = 3.43 x10⁻⁵ (pert near close to 0.000)
regression constant = 0.999
The equation for this line is
Stretch = 0.00406•Force + 3.43x10⁻⁵
The fact that the regression constant is very close to 1.000 indicates that there is a strong fitbetween the equation and the data points. This strong fit lends credibility to the results of the experiment.
This relationship between the force applied to a spring and the amount of stretch was first discovered in 1678 by English scientist Robert Hooke. As Hooke put it: Ut tensio, sic vis. Translated from Latin, this means "As the extension, so the force." In other words, the amount that the spring extends is proportional to the amount of force with which it pulls. If we had completed this study about 350 years ago (and if we knew some Latin), we would be famous! Today this quantitative relationship between force and stretch is referred to as Hooke's law and is often reported in textbooks as
Fspring = -k•x
where Fspring is the force exerted upon the spring, is the amount that the spring stretches relative to its relaxed position, and is the proportionality constant, often referred to as the spring constant. The spring constant is a positive constant whose value is dependent upon the spring which is being studied. A stiff spring would have a high spring constant. This is to say that it would take a relatively large amount of force to cause a little displacement. The units on the spring constant are Newton/meter (N/m). The negative sign in the above equation is an indication that the direction that the spring stretches is opposite the direction of the force which the spring exerts. For instance, when the spring was stretched below its relaxed position, x is downward. The spring responds to this stretching by exerting an upward force. The x and the F are in opposite directions. A final comment regarding this equation is that it works for a spring which is stretched vertically and for a spring is stretched horizontally (such as the one to be discussed below).

Force Analysis of a Mass on a Spring
we learned that an object that is vibrating is acted upon by a restoring force. The restoring force causes the vibrating object to slow down as it moves away from the equilibrium position and to speed up as it approaches the equilibrium position. It is this restoring force which is responsible for the vibration. So what is the restoring force for a mass on a spring?
We will begin our discussion of this question by considering the system in the diagram below.
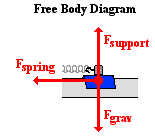
The diagram shows an air track and a glider. The glider is attached by a spring to a vertical support. There is a negligible amount of friction between the glider and the air track. As such, there are three dominant forces acting upon the glider. These three forces are shown in the free-body diagram at the right. The force of gravity (Fgrav) is a rather predictable force - both in terms of its magnitude and its direction. The force of gravity always acts downward; its magnitude can be found as the product of mass and the acceleration of gravity (m•9.8 N/kg). The support force (Fsupport) balances the force of gravity. It is supplied by the air from the air track, causing the glider to levitate about the track's surface. The final force is the spring force (Fspring). As discussed above, the spring force varies in magnitude and in direction. Its magnitude can be found using Hooke's law. Its direction is always opposite the direction of stretch and towards the equilibrium position. As the air track glider does the back and forth, the spring force (Fspring) acts as the restoring force. It acts leftward on the glider when it is positioned to the right of the equilibrium position; and it acts rightward on the glider when it is positioned to the left of the equilibrium position.
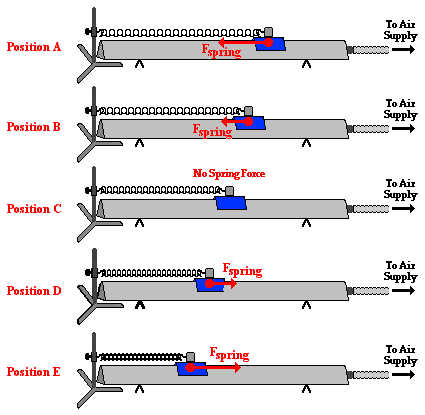
Let's suppose that the glider is pulled to the right of the equilibrium position and released from rest. The diagram below shows the direction of the spring force at five different positions over the course of the glider's path. As the glider moves from position A (the release point) to position B and then to position C, the spring force acts leftward upon the leftward moving glider. As the glider approaches position C, the amount of stretch of the spring decreases and the spring force decreases, consistent with Hooke's Law. Despite this decrease in the spring force, there is still an acceleration caused by the restoring force for the entire span from position A to position C. At position C, the glider has reached its maximum speed. Once the glider passes to the left of position C, the spring force acts rightward. During this phase of the glider's cycle, the spring is being compressed. The further past position C that the glider moves, the greater the amount of compression and the greater the spring force. This spring force acts as a restoring force, slowing the glider down as it moves from position C to position D to position E. By the time the glider has reached position E, it has slowed down to a momentary rest position before changing its direction and heading back towards the equilibrium position. During the glider's motion from position E to position C, the amount that the spring is compressed decreases and the spring force decreases. There is still an acceleration for the entire distance from position E to position C. At position C, the glider has reached its maximum speed. Now the glider begins to move to the right of point C. As it does, the spring force acts leftward upon the rightward moving glider. This restoring force causes the glider to slow down during the entire path from position C to position D to position E.
Sinusoidal Nature of the Motion of a Mass on a Spring
 the variations in the position of a mass on a spring with respect to time were discussed. At that time, it was shown that the position of a mass on a spring varies with the sine of the time. The discussion pertained to a mass that was vibrating up and down while suspended from the spring. The discussion would be just as applicable to our glider moving along the air track. If a motion detector were placed at the right end of the air track to collect data for a position vs. time plot, the plot would look like the plot below. Position A is the right-most position on the air track when the glider is closest to the detector.
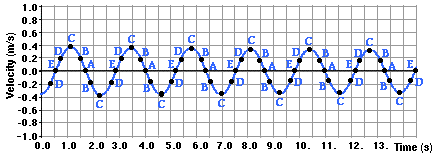
The labeled positions in the diagram above are the same positions used in the discussion of restoring force above. You might recall from that discussion that positions A and E were positions at which the mass had a zero velocity. Position C was the equilibrium position and was the position of maximum speed. If the same motion detector that collected position-time data were used to collect velocity-time data, then the plotted data would look like the graph below.
Observe that the velocity-time plot for the mass on a spring is also a sinusoidal shaped plot. The only difference between the position-time and the velocity-time plots is that one is shifted one-fourth of a vibrational cycle away from the other. Also observe in the plots that the absolute value of the velocity is greatest at position C (corresponding to the equilibrium position). The velocity of any moving object, whether vibrating or not, is the speed with a direction. The magnitude of the velocity is the speed. The direction is often expressed as a positive or a negative sign. In some instances, the velocity has a negative direction (the glider is moving leftward) and its velocity is plotted below the time axis. In other cases, the velocity has a positive direction (the glider is moving rightward) and its velocity is plotted above the time axis. You will also notice that the velocity is zero whenever the position is at an extreme. This occurs at positions A and E when the glider is beginning to change direction. So just as in the case of pendulum motion, the speed is greatest when the displacement of the mass relative to its equilibrium position is the least. And the speed is least when the displacement of the mass relative to its equilibrium position is the greatest.

Energy Analysis of a Mass on a Spring
On the previous page, an energy analysis for the vibration of a pendulum was discussed. Here we will conduct a similar analysis for the motion of a mass on a spring. In our discussion, we will refer to the motion of the frictionless glider on the air track that was introduced above. The glider will be pulled to the right of its equilibrium position and be released from rest (position A). As mentioned, the glider then accelerates towards position C (the equilibrium position). Once the glider passes the equilibrium position, it begins to slow down as the spring force pulls it backwards against its motion. By the time it has reached position E, the glider has slowed down to a momentary pause before changing directions and accelerating back towards position C. Once again, after the glider passes position C, it begins to slow down as it approaches position A. Once at position A, the cycle begins all over again ... and again ... and again.
The kinetic energy possessed by an object is the energy it possesses due to its motion. It is a quantity that depends upon both mass and speed. The equation that relates kinetic energy (KE) to mass (m) and speed (v) is
KE = ½•m•v2
The faster an object moves, the more kinetic energy that it will possess. We can combine this concept with the discussion above about how speed changes during the course of motion. This blending of the concepts would lead us to conclude that the kinetic energy of the mass on the spring increases as it approaches the equilibrium position; and it decreases as it moves away from the equilibrium position.
This information is summarized in the table below:
Stage of Cycle
Change in Speed
Change in Kinetic Energy
A to B to C
Increasing
Increasing
C to D to E
Decreasing
Decreasing
E to D to C
Increasing
Increasing
C to B to A
Decreasing
Decreasing
Kinetic energy is only one form of mechanical energy. The other form is potential energy. Potential energy is the stored energy of position possessed by an object. The potential energy could be gravitational potential energy, in which case the position refers to the height above the ground. Or the potential energy could be elastic potential energy, in which case the position refers to the position of the mass on the spring relative to the equilibrium position. For our vibrating air track glider, there is no change in height. So the gravitational potential energy does not change. This form of potential energy is not of much interest in our analysis of the energy changes. There is however a change in the position of the mass relative to its equilibrium position. Every time the spring is compressed or stretched relative to its relaxed position, there is an increase in the elastic potential energy. The amount of elastic potential energy depends on the amount of stretch or compression of the spring. The equation that relates the amount of elastic potential energy (PEspring) to the amount of compression or stretch (x) is
PEspring = ½ • k•x2
where k is the spring constant (in N/m) and x is the distance that the spring is stretched or compressed relative to the relaxed, unstretched position.
When the air track glider is at its equilibrium position (position C), it is moving it's fastest (as discussed above). At this position, the value of x is 0 meter. So the amount of elastic potential energy (PEspring) is 0 Joules. This is the position where the potential energy is the least. When the glider is at position A, the spring is stretched the greatest distance and the elastic potential energy is a maximum. A similar statement can be made for position E. At position E, the spring is compressed the most and the elastic potential energy at this location is also a maximum. Since the spring stretches as much as compresses, the elastic potential energy at position A (the stretched position) is the same as at position E (the compressed position). At these two positions - A and E - the velocity is 0 m/s and the kinetic energy is 0 J. So just like the case of a vibrating pendulum, a vibrating mass on a spring has the greatest potential energy when it has the smallest kinetic energy. And it also has the smallest potential energy (position C) when it has the greatest kinetic energy. These principles are shown in the animation below.
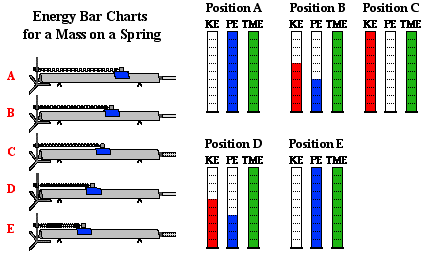
When conducting an energy analysis, a common representation is an energy bar chart. An energy bar chart uses a bar graph to represent the relative amount and form of energy possessed by an object as it is moving. It is a useful conceptual tool for showing what form of energy is present and how it changes over the course of time. The diagram below is an energy bar chart for the air track glider and spring system.
The bar chart reveals that as the mass on the spring moves from A to B to C, the kinetic energy increases and the elastic potential energy decreases. Yet the total amount of these two forms of mechanical energy remains constant. Mechanical energy is being transformed from potential form to kinetic form; yet the total amount is being conserved. A similar conservation of energy phenomenon occurs as the mass moves from C to D to E. As the spring becomes compressed and the mass slows down, its kinetic energy is transformed into elastic potential energy. As this transformation occurs, the total amount of mechanical energy is conserved. 

Period of a Mass on a Spring
As is likely obvious, not all springs are created equal. And not all spring-mass systems are created equal. One measurable quantity that can be used to distinguish one spring-mass system from another is the period. As discussed earlier in this lesson, the period is the time for a vibrating object to make one complete cycle of vibration. The variables that effect the period of a spring-mass system are the mass and the spring constant. The equation that relates these variables resembles the equation for the period of a pendulum. The equation is
T = 2•π•(m/k).5
where T is the period, m is the mass of the object attached to the spring, and k is the spring constant of the spring. The equation can be interpreted to mean that more massive objects will vibrate with a longer period. Their greaterinertia means that it takes more time to complete a cycle. And springs with a greater spring constant (stiffer springs) have a smaller period; masses attached to these springs take less time to complete a cycle. Their greater spring constant means they exert stronger restoring forces upon the attached mass. This greater force reduces the length of time to complete one cycle of vibration.

Pendulum Motion

Pendulum Motion

A simple pendulum consists of a relatively massive object hung by a string from a fixed support. It typically hangs vertically in its equilibrium position. The massive object is affectionately referred to as thependulum bob. When the bob is displaced from equilibrium and then released, it begins its back and forth vibration about its fixed equilibrium position. The motion is regular and repeating, an example of periodic motion. Pendulum motion was introduced
earlier  as we made an attempt to understand the nature of vibrating objects. Pendulum motion was discussed again as we looked at the mathematical properties of objects that are in periodic motion. Here we will investigate pendulum motion in even greater detail as we focus upon how a variety of quantities change over the course of time. Such quantities will include forces, position, velocity and energy - both kinetic and potential energy.

Force Analysis of a Pendulum
Earlier  we learned that an object that is vibrating is acted upon by a restoring force. The restoring force causes the vibrating object to slow down as it moves away from the equilibrium position and to speed up as it approaches the equilibrium position. It is this restoring force that is responsible for the vibration. So what forces act upon a pendulum bob? And what is the restoring force for a pendulum? There are two dominant forces acting upon a pendulum bob at all times during the course of its motion. There is the force of gravity that acts downward upon the bob. It results from the Earth's mass attracting the mass of the bob. And there is a tension force acting upward and towards the pivot point of the pendulum. The tension force results from the string pulling upon the bob of the pendulum. In our discussion, we will ignore the influence of air resistance - a third force that always opposes the motion of the bob as it swings to and fro. The air resistance force is relatively weak compared to the two dominant forces.
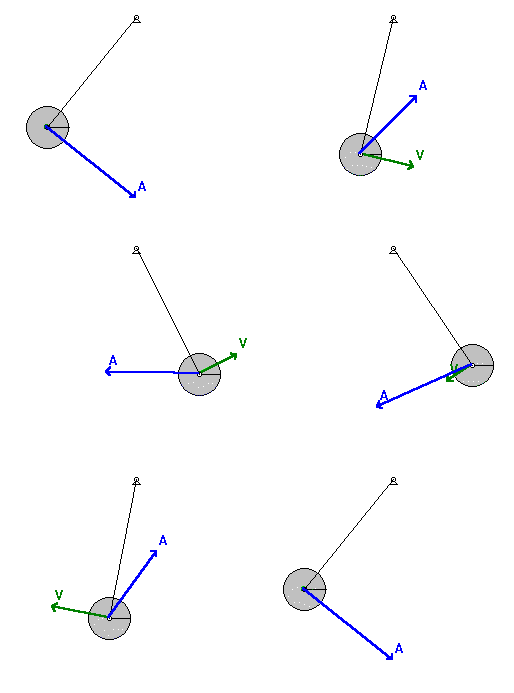
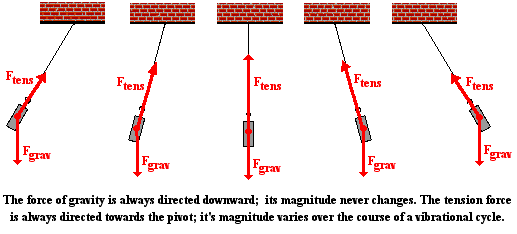
The gravity force is highly predictable; it is always in the same direction (down) and always of the same magnitude - mass*9.8 N/kg. The tension force is considerably less predictable. Both its direction and its magnitude change as the bob swings to and fro. The direction of the tension force is always towards the pivot point. So as the bob swings to the left of its equilibrium position, the tension force is at an angle - directed upwards and to the right. And as the bob swings to the right of its equilibrium position, the tension is directed upwards and to the left. The diagram below depicts the direction of these two forces at five different positions over the course of the pendulum's path.
In physical situations in which the forces acting on an object are not in the same, opposite or perpendicular directions, it is customary to resolve one or more of the forces into components. This was the practice used in the analysis of sign hanging problems and inclined plane problems. Typically one or more of the forces are resolved into perpendicular components that lie along coordinate axes that are directed in the direction of the acceleration or perpendicular to it. So in the case of a pendulum, it is the gravity force which gets resolved since the tension force is already directed perpendicular to the motion. The diagram at the right shows the pendulum bob at a position to the right of its equilibrium position and midway to the point of maximum displacement. A coordinate axis system is sketched on the diagram and the force of gravity is resolved into two components that lie along these axes. One of the components is directed tangent to the circular arc along which the pendulum bob moves; this component is labeled Fgrav-tangent. The other component is directed perpendicular to the arc; it is labeled Fgrav-perp. You will notice that the perpendicular component of gravity is in the opposite direction of the tension force. You might also notice that the tension force is slightly larger than this component of gravity. The fact that the tension force (Ftens) is greater than the perpendicular component of gravity (Fgrav-perp) means there will be a net force which is perpendicular to the arc of the bob's motion. This must be the case since we expect that objects that move along circular paths will experience an inward or centripetal force. The tangential component of gravity (Fgrav-tangent) is unbalanced by any other force. So there is a net force directed along the other coordinate axes. It is this tangential component of gravity which acts as the restoring force. As the pendulum bob moves to the right of the equilibrium position, this force component is directed opposite its motion back towards the equilibrium position.
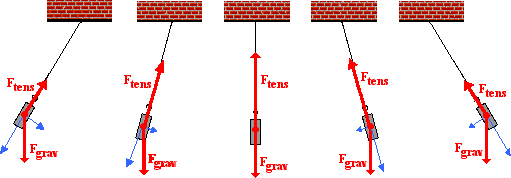
The above analysis applies for a single location along the pendulum's arc. At the other locations along the arc, the strength of the tension force will vary. Yet the process of resolving gravity into two components along axes that are perpendicular and tangent to the arc remains the same. The diagram below shows the results of the force analysis for several other positions.
There are a couple comments to be made. First, observe the diagram for when the bob is displaced to its maximum displacement to the right of the equilibrium position. This is the position in which the pendulum bob momentarily has a velocity of 0 m/s and is changing its direction. The tension force (Ftens) and the perpendicular component of gravity (Fgrav-perp) balance each other. At this instant in time, there is no net force directed along the axis that is perpendicular to the motion. Since the motion of the object is momentarily paused, there is no need for a centripetal force.
Second, observe the diagram for when the bob is at the equilibrium position (the string is completely vertical). When at this position, there is no component of force along the tangent direction. When moving through the equilibrium position, the restoring force is momentarily absent. Having been restored to the equilibrium position, there is no restoring force. The restoring force is only needed when the pendulum bob has been displaced away from the equilibrium position. You might also notice that the tension force (Ftens) is greater than the perpendicular component of gravity (Fgrav-perp) when the bob moves through this equilibrium position. Since the bob is in motion along a circular arc, there must be a net centripetal force at this position.

The Sinusoidal Nature of Pendulum Motion
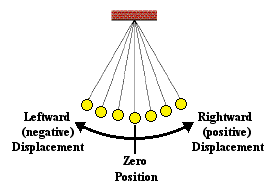
In the previous part , we investigated the sinusoidal nature of the motion of a mass on a spring. We will conduct a similar investigation here for the motion of a pendulum bob. Let's suppose that we could measure the amount that the pendulum bob is displaced to the left or to the right of its equilibrium or rest position over the course of time. A displacement to the right of the equilibrium position would be regarded as a positive displacement; and a displacement to the left would be regarded as a negative displacement. Using this reference frame, the equilibrium position would be regarded as the zero position. And suppose that we constructed a plot showing the variation in position with respect to time. The resulting position vs. time plot is shown below. Similar to what was observed for the mass on a spring, the position of the pendulum bob (measured along the arc relative to its rest position) is a function of the sine of the time.
Now suppose that we use our motion detector to investigate the how the velocity of the pendulum changes with respect to the time. As the pendulum bob does the back and forth, the velocity is continuously changing. There will be times at which the velocity is a negative value (for moving leftward) and other times at which it will be a positive value (for moving rightward). And of course there will be moments in time at which the velocity is 0 m/s. If the variations in velocity over the course of time were plotted, the resulting graph would resemble the one shown below.
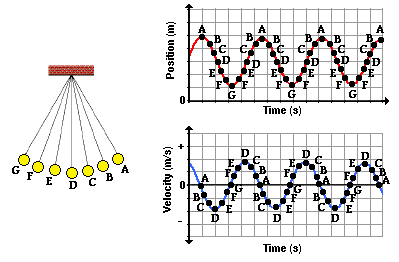
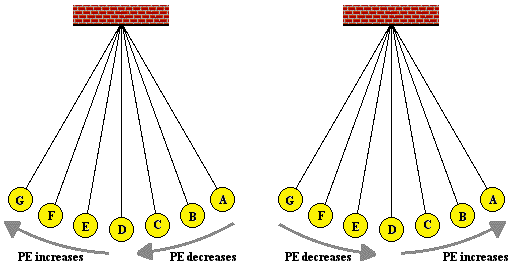
Now let's try to understand the relationship between the position of the bob along the arc of its motion and the velocity with which it moves. Suppose we identify several locations along the arc and then relate these positions to the velocity of the pendulum bob. The graphic below shows an effort to make such a connection between position and velocity.
As is often said, a picture is worth a thousand words. Now here come the words. The plot above is based upon the equilibrium position (D) being designated as the zero position. A displacement to the left of the equilibrium position is regarded as a negative position. A displacement to the right is regarded as a positive position. An analysis of the plots shows that the velocity is least when the displacement is greatest. And the velocity is greatest when the displacement of the bob is least. The further the bob has moved away from the equilibrium position, the slower it moves; and the closer the bob is to the equilibrium position, the faster it moves. This can be explained by the fact that as the bob moves away from the equilibrium position, there is a restoring force that opposes its motion. This force slows the bob down. So as the bob moves leftward from position D to E to F to G, the force and acceleration is directed rightward and the velocity decreases as it moves along the arc from D to G. At G - the maximum displacement to the left - the pendulum bob has a velocity of 0 m/s. You might think of the bob as being momentarily paused and ready to change its direction. Next the bob moves rightward along the arc from G to F to E to D. As it does, the restoring force is directed to the right in the same direction as the bob is moving. This force will accelerate the bob, giving it a maximum speed at position D - the equilibrium position. As the bob moves past position D, it is moving rightward along the arc towards C, then B and then A. As it does, there is a leftward restoring force opposing its motion and causing it to slow down. So as the displacement increases from D to A, the speed decreases due to the opposing force. Once the bob reaches position A - the maximum displacement to the right - it has attained a velocity of 0 m/s. Once again, the bob's velocity is least when the displacement is greatest. The bob completes its cycle, moving leftward from A to B to C to D. Along this arc from A to D, the restoring force is in the direction of the motion, thus speeding the bob up. So it would be logical to conclude that as the position decreases (along the arc from A to D), the velocity increases. Once at position D, the bob will have a zero displacement and a maximum velocity. The velocity is greatest when the displacement is least. The animation at the right (used with the permission of Wikimedia Commons; special thanks to Hubert Christiaen) provides a visual depiction of these principles. The acceleration vector that is shown combines both the perpendicular and the tangential accelerations into a single vector. You will notice that this vector is entirely tangent to the arc when at maximum displacement; this is consistent with the force analysis discussed above. And the vector is vertical (towards the center of the arc) when at the equilibrium position. This also is consistent with the force analysis discussed above.
Energy Analysis
 discussion here as we make an effort to associate the motion characteristics described above with the concepts of kinetic energy, potential energy and total mechanical energy.
The kinetic energy possessed by an object is the energy it possesses due to its motion. It is a quantity that depends upon both mass and speed. The equation that relates kinetic energy (KE) to mass (m) and speed (v) is
KE = ½•m•v2
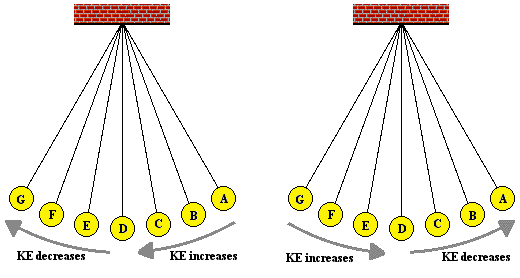
The faster an object moves, the more kinetic energy that it will possess. We can combine this concept with the discussion above about how speed changes during the course of motion. This blending of concepts would lead us to conclude that the kinetic energy of the pendulum bob increases as the bob approaches the equilibrium position. And the kinetic energy decreases as the bob moves further away from the equilibrium position.

The potential energy possessed by an object is the stored energy of position. Two types of potential energy are discussed in The Physics Classroom Tutorial - gravitational potential energy and elastic potential energy. Elastic potential energy is only present when a spring (or other elastic medium) is compressed or stretched. A simple pendulum does not consist of a spring. The form of potential energy possessed by a pendulum bob is gravitational potential energy. The amount of gravitational potential energy is dependent upon the mass (m) of the object and the height (h) of the object. The equation for gravitational potential energy (PE) is
PE = m•g•h
where g represents the gravitational field strength (sometimes referred to as the acceleration caused by gravity) and has the value of 9.8 N/kg.
The height of an object is expressed relative to some arbitrarily assigned zero level. In other words, the height must be measured as a vertical distance above some reference position. For a pendulum bob, it is customary to call the lowest position the reference position or the zero level. So when the bob is at the equilibrium position (the lowest position), its height is zero and its potential energy is 0 J. As the pendulum bob does the back and forth, there are times during which the bob is moving away from the equilibrium position. As it does, its height is increasing as it moves further and further away. It reaches a maximum height as it reaches the position of maximum displacement from the equilibrium position. As the bob moves towards its equilibrium position, it decreases its height and decreases its potential energy.
Now let's put these two concepts of kinetic energy and potential energy together as we consider the motion of a pendulum bob moving along the arc shown in the diagram at the right. We will use an energy bar chart to represent the changes in the two forms of energy. The amount of each form of energy is represented by a bar. The height of the bar is proportional to the amount of that form of energy. In addition to the potential energy (PE) bar and kinetic energy (KE) bar, there is a third bar labeled TME. The TME bar represents the total amount of mechanical energy possessed by the pendulum bob. The total mechanical energy is simply the sum of the two forms of energy – kinetic plus potential energy. Take some time to inspect the bar charts shown below for positions A, B, D, F and G. What do you notice?
When you inspect the bar charts, it is evident that as the bob moves from A to D, the kinetic energy is increasing and the potential energy is decreasing. However, the total amount of these two forms of energy is remaining constant. Whatever potential energy is lost in going from position A to position D appears as kinetic energy. There is a transformation of potential energy into kinetic energy as the bob moves from position A to position D. Yet the total mechanical energy remains constant. We would say that mechanical energy is conserved. As the bob moves past position D towards position G, the opposite is observed. Kinetic energy decreases as the bob moves rightward and (more importantly) upward toward position G. There is an increase in potential energy to accompany this decrease in kinetic energy. Energy is being transformed from kinetic form into potential form. Yet, as illustrated by the TME bar, the total amount of mechanical energy is conserved. 

The Period of a Pendulum
Our final discussion will pertain to the period of the pendulum. As discussed previously in this lesson, the period is the time it takes for a vibrating object to complete its cycle. In the case of pendulum, it is the time for the pendulum to start at one extreme, travel to the opposite extreme, and then return to the original location. Here we will be interested in the question What variables affect the period of a pendulum? We will concern ourselves with possible variables. The variables are the mass of the pendulum bob, the length of the string on which it hangs, and the angular displacement. The angular displacement or arc angle is the angle that the string makes with the vertical when released from rest. These three variables and their effect on the period are easily studied and are often the focus of a physics lab in an introductory physics class. The data table below provides representative data for such a study.
Trial
Mass (kg)
Length (m)
Arc Angle (°)
Period (s)
1
0.02-
0.40
15.0
1.25
2
0.050
0.40
15.0
1.29
3
0.100
0.40
15.0
1.28
4
0.200
0.40
15.0
1.24
5
0.500
0.40
15.0
1.26
6
0.200
0.60
15.0
1.56
7
0.200
0.80
15.0
1.79
8
0.200
1.00
15.0
2.01
9
0.200
1.20
15.0
2.19
10
0.200
0.40
10.0
1.27
11
0.200
0.40
20.0
1.29
12
0.200
0.40
25.0
1.25
13
0.200
0.40
30.0
1.26
In trials 1 through 5, the mass of the bob was systematically altered while keeping the other quantities constant. By so doing, the experimenters were able to investigate the possible effect of the mass upon the period. As can be seen in these five trials, alterations in mass have little effect upon the period of the pendulum.
In trials 4 and 6-9, the mass is held constant at 0.200 kg and the arc angle is held constant at 15°. However, the length of the pendulum is varied. By so doing, the experimenters were able to investigate the possible effect of the length of the string upon the period. As can be seen in these five trials, alterations in length definitely have an effect upon the period of the pendulum. As the string is lengthened, the period of the pendulum is increased. There is a direct relationship between the period and the length.
Finally, the experimenters investigated the possible effect of the arc angle upon the period in trials 4 and 10-13. The mass is held constant at 0.200 kg and the string length is held constant at 0.400 m. As can be seen from these five trials, alterations in the arc angle have little to no effect upon the period of the pendulum.
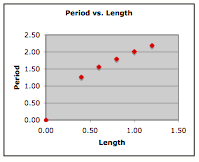
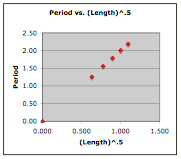
So the conclusion from such an experiment is that the one variable that effects the period of the pendulum is the length of the string. Increases in the length lead to increases in the period. But the investigation doesn't have to stop there. The quantitative equation relating these variables can be determined if the data is plotted and linear regression analysis is performed. The two plots below represent such an analysis. In each plot, values of period (the dependent variable) are placed on the vertical axis. In the plot on the left, the length of the pendulum is placed on the horizontal axis. The shape of the curve indicates some sort of power relationship between period and length. In the plot on the right, the square root of the length of the pendulum (length to the ½ power) is plotted. The results of the regression analysis are shown.
Slope: 1.7536
Y-intercept: 0.2616
COR: 0.9183
Slope: 2.0045
Y-intercept: 0.0077
COR: 0.9999
The analysis shows that there is a better fit of the data and the regression line for the graph on the right. As such, the plot on the right is the basis for the equation relating the period and the length. For this data, the equation is
Period = 2.0045•Length0.5 + 0.0077
Using T as the symbol for period and L as the symbol for length, the equation can be rewritten as
T = 2.0045•L0.5 + 0.0077
The commonly reported equation based on theoretical development is
T = 2•π•(L/g)0.5
where g is a constant known as the gravitational field strength or the acceleration of gravity (9.8 N/kg). The value of 2.0045 from the experimental investigation agrees well with what would be expected from this theoretically reported equation. Substituting the value of g into this equation, yields a proportionality constant of 2π/g0.5, which is 2.0071, very similar to the 2.0045 proportionality constant developed in the experiment.

Pendulum Motion

A simple pendulum consists of a relatively massive object hung by a string from a fixed support. It typically hangs vertically in its equilibrium position. The massive object is affectionately referred to as thependulum bob. When the bob is displaced from equilibrium and then released, it begins its back and forth vibration about its fixed equilibrium position. The motion is regular and repeating, an example of periodic motion. Pendulum motion was introduced
earlier  as we made an attempt to understand the nature of vibrating objects. Pendulum motion was discussed again as we looked at the mathematical properties of objects that are in periodic motion. Here we will investigate pendulum motion in even greater detail as we focus upon how a variety of quantities change over the course of time. Such quantities will include forces, position, velocity and energy - both kinetic and potential energy.

Force Analysis of a Pendulum
Earlier  we learned that an object that is vibrating is acted upon by a restoring force. The restoring force causes the vibrating object to slow down as it moves away from the equilibrium position and to speed up as it approaches the equilibrium position. It is this restoring force that is responsible for the vibration. So what forces act upon a pendulum bob? And what is the restoring force for a pendulum? There are two dominant forces acting upon a pendulum bob at all times during the course of its motion. There is the force of gravity that acts downward upon the bob. It results from the Earth's mass attracting the mass of the bob. And there is a tension force acting upward and towards the pivot point of the pendulum. The tension force results from the string pulling upon the bob of the pendulum. In our discussion, we will ignore the influence of air resistance - a third force that always opposes the motion of the bob as it swings to and fro. The air resistance force is relatively weak compared to the two dominant forces.
The gravity force is highly predictable; it is always in the same direction (down) and always of the same magnitude - mass*9.8 N/kg. The tension force is considerably less predictable. Both its direction and its magnitude change as the bob swings to and fro. The direction of the tension force is always towards the pivot point. So as the bob swings to the left of its equilibrium position, the tension force is at an angle - directed upwards and to the right. And as the bob swings to the right of its equilibrium position, the tension is directed upwards and to the left. The diagram below depicts the direction of these two forces at five different positions over the course of the pendulum's path.
In physical situations in which the forces acting on an object are not in the same, opposite or perpendicular directions, it is customary to resolve one or more of the forces into components. This was the practice used in the analysis of sign hanging problems and inclined plane problems. Typically one or more of the forces are resolved into perpendicular components that lie along coordinate axes that are directed in the direction of the acceleration or perpendicular to it. So in the case of a pendulum, it is the gravity force which gets resolved since the tension force is already directed perpendicular to the motion. The diagram at the right shows the pendulum bob at a position to the right of its equilibrium position and midway to the point of maximum displacement. A coordinate axis system is sketched on the diagram and the force of gravity is resolved into two components that lie along these axes. One of the components is directed tangent to the circular arc along which the pendulum bob moves; this component is labeled Fgrav-tangent. The other component is directed perpendicular to the arc; it is labeled Fgrav-perp. You will notice that the perpendicular component of gravity is in the opposite direction of the tension force. You might also notice that the tension force is slightly larger than this component of gravity. The fact that the tension force (Ftens) is greater than the perpendicular component of gravity (Fgrav-perp) means there will be a net force which is perpendicular to the arc of the bob's motion. This must be the case since we expect that objects that move along circular paths will experience an inward or centripetal force. The tangential component of gravity (Fgrav-tangent) is unbalanced by any other force. So there is a net force directed along the other coordinate axes. It is this tangential component of gravity which acts as the restoring force. As the pendulum bob moves to the right of the equilibrium position, this force component is directed opposite its motion back towards the equilibrium position.
The above analysis applies for a single location along the pendulum's arc. At the other locations along the arc, the strength of the tension force will vary. Yet the process of resolving gravity into two components along axes that are perpendicular and tangent to the arc remains the same. The diagram below shows the results of the force analysis for several other positions.
There are a couple comments to be made. First, observe the diagram for when the bob is displaced to its maximum displacement to the right of the equilibrium position. This is the position in which the pendulum bob momentarily has a velocity of 0 m/s and is changing its direction. The tension force (Ftens) and the perpendicular component of gravity (Fgrav-perp) balance each other. At this instant in time, there is no net force directed along the axis that is perpendicular to the motion. Since the motion of the object is momentarily paused, there is no need for a centripetal force.
Second, observe the diagram for when the bob is at the equilibrium position (the string is completely vertical). When at this position, there is no component of force along the tangent direction. When moving through the equilibrium position, the restoring force is momentarily absent. Having been restored to the equilibrium position, there is no restoring force. The restoring force is only needed when the pendulum bob has been displaced away from the equilibrium position. You might also notice that the tension force (Ftens) is greater than the perpendicular component of gravity (Fgrav-perp) when the bob moves through this equilibrium position. Since the bob is in motion along a circular arc, there must be a net centripetal force at this position.

The Sinusoidal Nature of Pendulum Motion
In the previous part , we investigated the sinusoidal nature of the motion of a mass on a spring. We will conduct a similar investigation here for the motion of a pendulum bob. Let's suppose that we could measure the amount that the pendulum bob is displaced to the left or to the right of its equilibrium or rest position over the course of time. A displacement to the right of the equilibrium position would be regarded as a positive displacement; and a displacement to the left would be regarded as a negative displacement. Using this reference frame, the equilibrium position would be regarded as the zero position. And suppose that we constructed a plot showing the variation in position with respect to time. The resulting position vs. time plot is shown below. Similar to what was observed for the mass on a spring, the position of the pendulum bob (measured along the arc relative to its rest position) is a function of the sine of the time.
Now suppose that we use our motion detector to investigate the how the velocity of the pendulum changes with respect to the time. As the pendulum bob does the back and forth, the velocity is continuously changing. There will be times at which the velocity is a negative value (for moving leftward) and other times at which it will be a positive value (for moving rightward). And of course there will be moments in time at which the velocity is 0 m/s. If the variations in velocity over the course of time were plotted, the resulting graph would resemble the one shown below.
Now let's try to understand the relationship between the position of the bob along the arc of its motion and the velocity with which it moves. Suppose we identify several locations along the arc and then relate these positions to the velocity of the pendulum bob. The graphic below shows an effort to make such a connection between position and velocity.
As is often said, a picture is worth a thousand words. Now here come the words. The plot above is based upon the equilibrium position (D) being designated as the zero position. A displacement to the left of the equilibrium position is regarded as a negative position. A displacement to the right is regarded as a positive position. An analysis of the plots shows that the velocity is least when the displacement is greatest. And the velocity is greatest when the displacement of the bob is least. The further the bob has moved away from the equilibrium position, the slower it moves; and the closer the bob is to the equilibrium position, the faster it moves. This can be explained by the fact that as the bob moves away from the equilibrium position, there is a restoring force that opposes its motion. This force slows the bob down. So as the bob moves leftward from position D to E to F to G, the force and acceleration is directed rightward and the velocity decreases as it moves along the arc from D to G. At G - the maximum displacement to the left - the pendulum bob has a velocity of 0 m/s. You might think of the bob as being momentarily paused and ready to change its direction. Next the bob moves rightward along the arc from G to F to E to D. As it does, the restoring force is directed to the right in the same direction as the bob is moving. This force will accelerate the bob, giving it a maximum speed at position D - the equilibrium position. As the bob moves past position D, it is moving rightward along the arc towards C, then B and then A. As it does, there is a leftward restoring force opposing its motion and causing it to slow down. So as the displacement increases from D to A, the speed decreases due to the opposing force. Once the bob reaches position A - the maximum displacement to the right - it has attained a velocity of 0 m/s. Once again, the bob's velocity is least when the displacement is greatest. The bob completes its cycle, moving leftward from A to B to C to D. Along this arc from A to D, the restoring force is in the direction of the motion, thus speeding the bob up. So it would be logical to conclude that as the position decreases (along the arc from A to D), the velocity increases. Once at position D, the bob will have a zero displacement and a maximum velocity. The velocity is greatest when the displacement is least. The animation at the right (used with the permission of Wikimedia Commons; special thanks to Hubert Christiaen) provides a visual depiction of these principles. The acceleration vector that is shown combines both the perpendicular and the tangential accelerations into a single vector. You will notice that this vector is entirely tangent to the arc when at maximum displacement; this is consistent with the force analysis discussed above. And the vector is vertical (towards the center of the arc) when at the equilibrium position. This also is consistent with the force analysis discussed above.
Energy Analysis
 discussion here as we make an effort to associate the motion characteristics described above with the concepts of kinetic energy, potential energy and total mechanical energy.
The kinetic energy possessed by an object is the energy it possesses due to its motion. It is a quantity that depends upon both mass and speed. The equation that relates kinetic energy (KE) to mass (m) and speed (v) is
KE = ½•m•v2
The faster an object moves, the more kinetic energy that it will possess. We can combine this concept with the discussion above about how speed changes during the course of motion. This blending of concepts would lead us to conclude that the kinetic energy of the pendulum bob increases as the bob approaches the equilibrium position. And the kinetic energy decreases as the bob moves further away from the equilibrium position.

The potential energy possessed by an object is the stored energy of position. Two types of potential energy are discussed in The Physics Classroom Tutorial - gravitational potential energy and elastic potential energy. Elastic potential energy is only present when a spring (or other elastic medium) is compressed or stretched. A simple pendulum does not consist of a spring. The form of potential energy possessed by a pendulum bob is gravitational potential energy. The amount of gravitational potential energy is dependent upon the mass (m) of the object and the height (h) of the object. The equation for gravitational potential energy (PE) is
PE = m•g•h
where g represents the gravitational field strength (sometimes referred to as the acceleration caused by gravity) and has the value of 9.8 N/kg.
The height of an object is expressed relative to some arbitrarily assigned zero level. In other words, the height must be measured as a vertical distance above some reference position. For a pendulum bob, it is customary to call the lowest position the reference position or the zero level. So when the bob is at the equilibrium position (the lowest position), its height is zero and its potential energy is 0 J. As the pendulum bob does the back and forth, there are times during which the bob is moving away from the equilibrium position. As it does, its height is increasing as it moves further and further away. It reaches a maximum height as it reaches the position of maximum displacement from the equilibrium position. As the bob moves towards its equilibrium position, it decreases its height and decreases its potential energy.
Now let's put these two concepts of kinetic energy and potential energy together as we consider the motion of a pendulum bob moving along the arc shown in the diagram at the right. We will use an energy bar chart to represent the changes in the two forms of energy. The amount of each form of energy is represented by a bar. The height of the bar is proportional to the amount of that form of energy. In addition to the potential energy (PE) bar and kinetic energy (KE) bar, there is a third bar labeled TME. The TME bar represents the total amount of mechanical energy possessed by the pendulum bob. The total mechanical energy is simply the sum of the two forms of energy – kinetic plus potential energy. Take some time to inspect the bar charts shown below for positions A, B, D, F and G. What do you notice?
When you inspect the bar charts, it is evident that as the bob moves from A to D, the kinetic energy is increasing and the potential energy is decreasing. However, the total amount of these two forms of energy is remaining constant. Whatever potential energy is lost in going from position A to position D appears as kinetic energy. There is a transformation of potential energy into kinetic energy as the bob moves from position A to position D. Yet the total mechanical energy remains constant. We would say that mechanical energy is conserved. As the bob moves past position D towards position G, the opposite is observed. Kinetic energy decreases as the bob moves rightward and (more importantly) upward toward position G. There is an increase in potential energy to accompany this decrease in kinetic energy. Energy is being transformed from kinetic form into potential form. Yet, as illustrated by the TME bar, the total amount of mechanical energy is conserved. 

The Period of a Pendulum
Our final discussion will pertain to the period of the pendulum. As discussed previously in this lesson, the period is the time it takes for a vibrating object to complete its cycle. In the case of pendulum, it is the time for the pendulum to start at one extreme, travel to the opposite extreme, and then return to the original location. Here we will be interested in the question What variables affect the period of a pendulum? We will concern ourselves with possible variables. The variables are the mass of the pendulum bob, the length of the string on which it hangs, and the angular displacement. The angular displacement or arc angle is the angle that the string makes with the vertical when released from rest. These three variables and their effect on the period are easily studied and are often the focus of a physics lab in an introductory physics class. The data table below provides representative data for such a study.
Trial
Mass (kg)
Length (m)
Arc Angle (°)
Period (s)
1
0.02-
0.40
15.0
1.25
2
0.050
0.40
15.0
1.29
3
0.100
0.40
15.0
1.28
4
0.200
0.40
15.0
1.24
5
0.500
0.40
15.0
1.26
6
0.200
0.60
15.0
1.56
7
0.200
0.80
15.0
1.79
8
0.200
1.00
15.0
2.01
9
0.200
1.20
15.0
2.19
10
0.200
0.40
10.0
1.27
11
0.200
0.40
20.0
1.29
12
0.200
0.40
25.0
1.25
13
0.200
0.40
30.0
1.26
In trials 1 through 5, the mass of the bob was systematically altered while keeping the other quantities constant. By so doing, the experimenters were able to investigate the possible effect of the mass upon the period. As can be seen in these five trials, alterations in mass have little effect upon the period of the pendulum.
In trials 4 and 6-9, the mass is held constant at 0.200 kg and the arc angle is held constant at 15°. However, the length of the pendulum is varied. By so doing, the experimenters were able to investigate the possible effect of the length of the string upon the period. As can be seen in these five trials, alterations in length definitely have an effect upon the period of the pendulum. As the string is lengthened, the period of the pendulum is increased. There is a direct relationship between the period and the length.
Finally, the experimenters investigated the possible effect of the arc angle upon the period in trials 4 and 10-13. The mass is held constant at 0.200 kg and the string length is held constant at 0.400 m. As can be seen from these five trials, alterations in the arc angle have little to no effect upon the period of the pendulum.
So the conclusion from such an experiment is that the one variable that effects the period of the pendulum is the length of the string. Increases in the length lead to increases in the period. But the investigation doesn't have to stop there. The quantitative equation relating these variables can be determined if the data is plotted and linear regression analysis is performed. The two plots below represent such an analysis. In each plot, values of period (the dependent variable) are placed on the vertical axis. In the plot on the left, the length of the pendulum is placed on the horizontal axis. The shape of the curve indicates some sort of power relationship between period and length. In the plot on the right, the square root of the length of the pendulum (length to the ½ power) is plotted. The results of the regression analysis are shown.
Slope: 1.7536
Y-intercept: 0.2616
COR: 0.9183
Slope: 2.0045
Y-intercept: 0.0077
COR: 0.9999
The analysis shows that there is a better fit of the data and the regression line for the graph on the right. As such, the plot on the right is the basis for the equation relating the period and the length. For this data, the equation is
Period = 2.0045•Length0.5 + 0.0077
Using T as the symbol for period and L as the symbol for length, the equation can be rewritten as
T = 2.0045•L0.5 + 0.0077
The commonly reported equation based on theoretical development is
T = 2•π•(L/g)0.5
where g is a constant known as the gravitational field strength or the acceleration of gravity (9.8 N/kg). The value of 2.0045 from the experimental investigation agrees well with what would be expected from this theoretically reported equation. Substituting the value of g into this equation, yields a proportionality constant of 2π/g0.5, which is 2.0071, very similar to the 2.0045 proportionality constant developed in the experiment.
 
Support : Creating Website | Johny Template | Mas Template
Copyright © 2011. PHYSICS - All Rights Reserved
Template Created by Creating Website Published by Mas Template
Proudly powered by Premium Blogger Template